We are releasing the PTS Scores based on the most recent human rights reports from Amnesty International, Human Rights Watch and the U.S. State Department. Importantly and as in 2014, Amnesty International did not publish its full Annual Report this year and only provided reports for 19 countries in the Middle East and North Africa (see: Human Rights in the Middle East and North Africa: Review of 2018). We coded these 19 reports and included them in this data release. Amnesty International informed us that they hope to publish reports for the Middle East and North Africa again next year and hope to add other regional reports in the future. However, according to Amnesty International’s Richard Swingler, “current expectations are that, for the moment, we will NOT be publishing the global combined annual report in the future, though this is subject to internal discussions” (emphasis added).
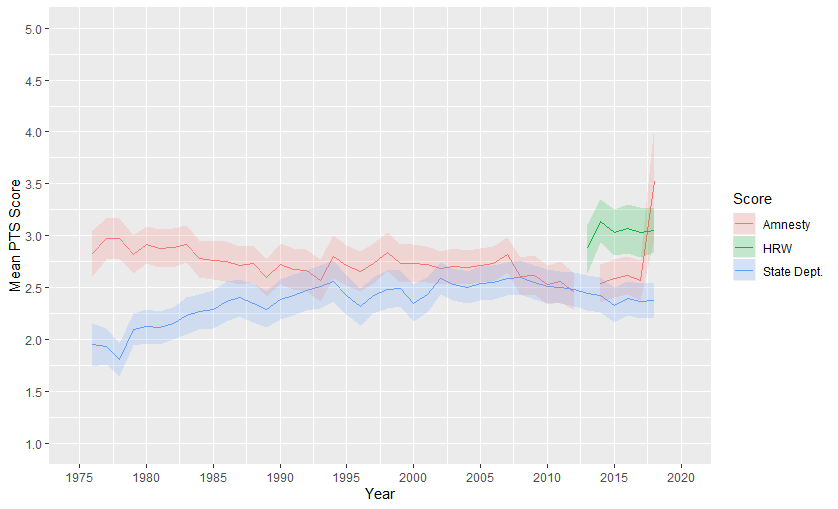
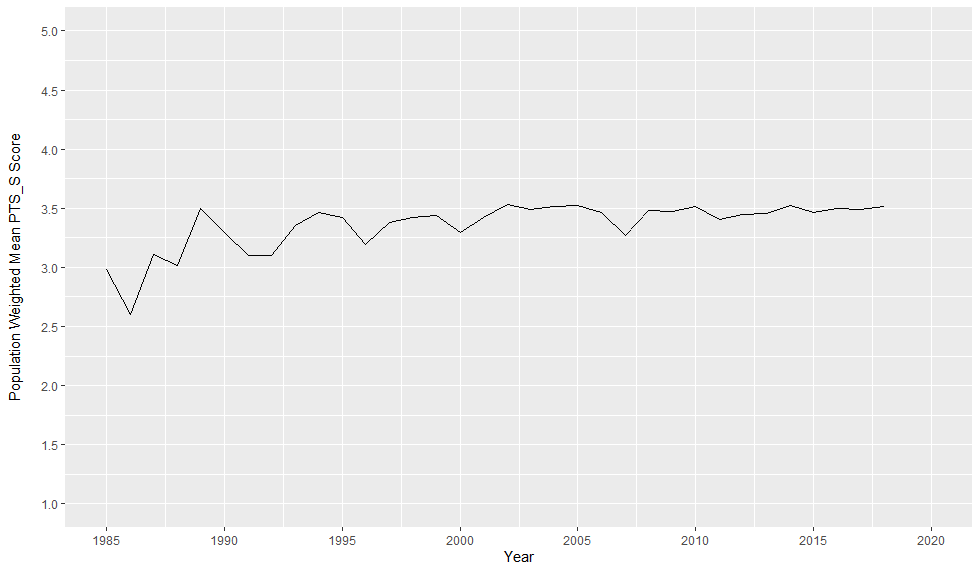
Figure 1b (right): Shown are population weighted annual average PTS_S scores. Countries with larger populations (e.g., China, India) are weighted more in the average than the scores for small micro-states (e.g., Nauru, Liechtenstein). Population data are taken from the World Bank.
This year’s data release covers events that took place between 1976 and 2018 and in a combined 211 countries and territories. Figure 1a above, shows the annual average PTS scores over the period. What is noteworthy, is the spike of the PTS score based on Amnesty International’s report. On its face, the trend (for PTS_A) indicates a dramatic worsening of human rights conditions. This, however, is misleading, when considering that only 19 countries in the Middle East and North Africa contribute to the 2018 average. These 19 countries, do not constitute a random sample and in fact all hail from one of the world’s most troubled and conflict riddled regions.
Figure 1b shows the population weighted annual average PTS scores based on the U.S. State Department reports from 1985 to 2018.1 What this figure illustrates is that human rights conditions experienced by the average person globally are much worse than the conditions implied by unweighted annual averages (an average of about 3.5 in 2018 compared to the unweighted PTS_S average of about 2.4). Put differently, more people live in countries with poor human rights records (e.g., China or India) than in countries that experience low levels of state perpetrated human rights violations (e.g., Denmark or Canada). While 38 out of 197 (19.3%) countries or territories perpetrate flagrant human rights abuses and received PTS_S scores of 4 or 5 in 2018, almost 70% of the world’s population inhabit these countries and territories. As shown in Table 1, the vast majority of the world’s population faces severe threats to their basic human rights.
| 2018 PTS_S Score | Number of Countries | Percentage of Countries | Population | Percentage of Population |
|---|---|---|---|---|
| |
62 | 31.47% | 613,843,363 | 8.49% |
| |
48 | 24.37% | 517,040,094 | 7.15% |
| |
49 | 24.87% | 1,051,381,496 | 14.54% |
| |
27 | 13.71% | 4,656,974,847 | 64.41% |
| |
11 | 5.58% | 390,893,377 | 5.41% |
| Total | 197 | 100% | 7,230,133,177 | 100% |
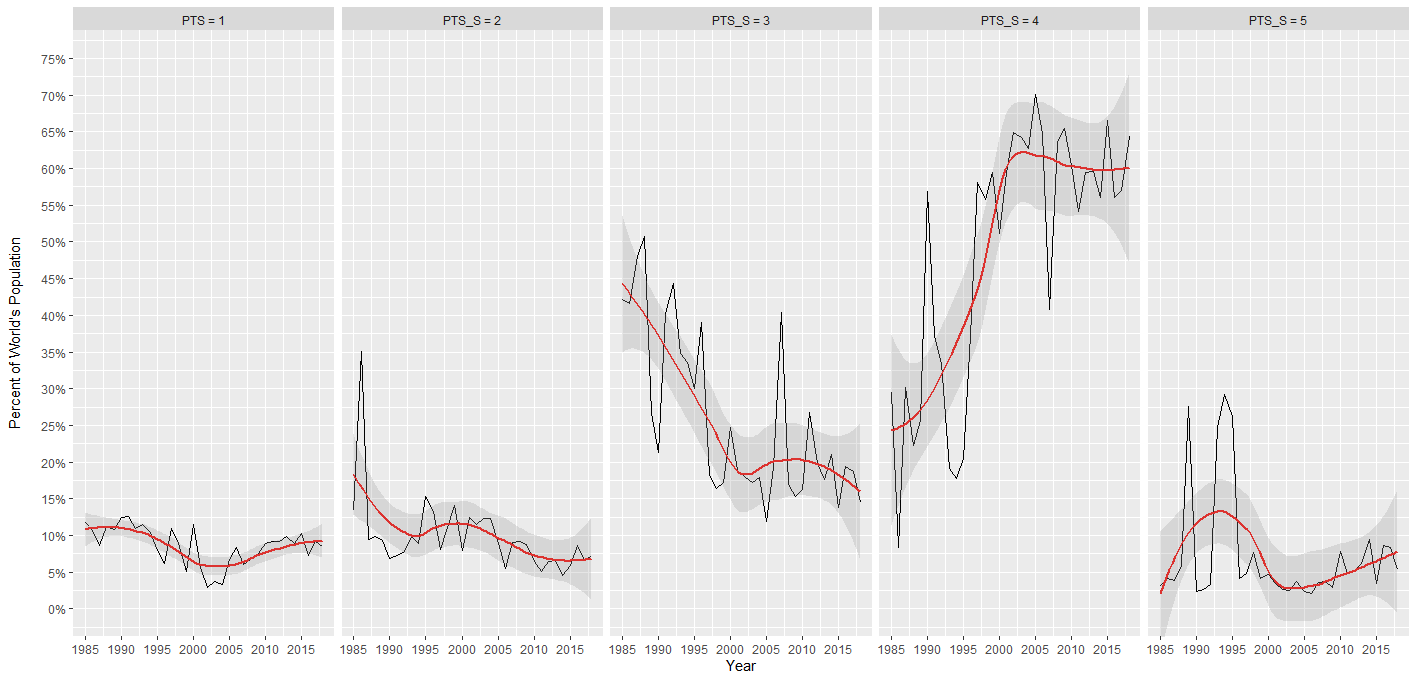
The proportion of the world’s population experiencing varying levels of human rights conditions is represented in Figure 2. The left most panel shows the proportion of the the world’s inhabitants living in a country with good human rights records (a PTS_S score of 1). Since the mid-1980 about 10% of the world’s inhabitants experience no or low threats to physical integrity rights. What is striking, are the trends observed in panels 3 and 4. While nearly 45% of the world’s population lived in a country with middling human rights conditions (a PTS_S score of 3) in 1985, by the year 2000 this percentage had dropped to below 20%. “Only” about a quarter of the world’s population lived in a country with a PTS_S score of 4 in 1985. At the turn of the millennium, this percentage had skyrocketed to above 60% indicating a dramatic worsening of human rights conditions for well over a quarter of the world’s population.
These and other trends can and deserve to be explored further. Newly, included in this year’s release are PTS_S scores for a random sample of 49 countries/territories from prior years whose reports had not been coded at the time. Most of these scores are for micro-states such as Andorra, Dominica, or Palau but also include Iran 1978, Chad 1981, and Mongolia 1989 and 1990. (For a complete list see below or consult the Release Notes). We hope to continue to back-code over 400 other missing scores over the next few years.
This year’s release includes:
-
19 PTS scores based on the 2019 Amnesty International Human Rights in the Middle East and North Africa: Review of 2018.
-
97 PTS scores based on the 2019 Human Rights Watch World Report.
-
197 PTS scores based on the 2019 U.S. State Department Country Reports on Human Rights Practices.
-
49 PTS scores based on U.S. State Department reports that had not previously been coded.
All data, as well as the latest version of the codebook PTS-Codebook can be accessed here: Download
The Data Table on the website and the PTS-App have been updated and also contain the latest scores.
Notes:
Last year’s version will still be available in various formats (i.e., .xlsx, .dta, .RData, and .csv) in our Data-Archive.
-
In this release we renamed Swaziland and Macedonia to Eswatini and North Macedonia, respectively.
-
We added PTS_S scores based on previously uncoded U.S. State Department reports for the following 49 countries and territories:
- Andorra 1994
- Andorra 1995
- Andorra 1999
- Andorra 2002
- Andorra 2004
- Andorra 2006
- Antigua and Barbuda 2006
- Antigua and Barbuda 2011
- Belize 1983
- Bhutan 1980
- Bhutan 1981
- Bhutan 1987
- Chad 1981
- Cyprus 1992
- Cyprus 1993
- Dominica 1989
- Dominica 1992
- Dominica 2012
- Dominica 2013
- Fiji 1989
- Fiji 1991
- Iran 1978
- Kiribati 1999
- Kiribati 2004
- Lebanon 1981
- Lebanon 1982
- Liechtenstein 2001
- Malawi 1987
- Micronesia, Federated States of 2004
- Monaco 2003
- Monaco 2005
- Monaco 2010
- Mongolia 1989
- Mongolia 1990
- Montenegro 2006
- Namibia 1981
- Palau 2000
- Palau 2001
- Palau 2005
- Palau 2006
- Palau 2007
- Palau 2010
- St. Kitts and Nevis 2012
- San Marino 2004
- San Marino 2010
- Tonga 2005
- Tuvalu 1993
- Western Sahara 2009
- Western Sahara 2011
Again, past releases (i.e., 2015, 2016, 2017, 2018) of the PTS dataset can be found here: Data-Archive
-
Population data have been taken from the World Bank and can be found here: https://data.worldbank.org. ↩